Goodbye MongoDB World, Hello Open Source Bridge

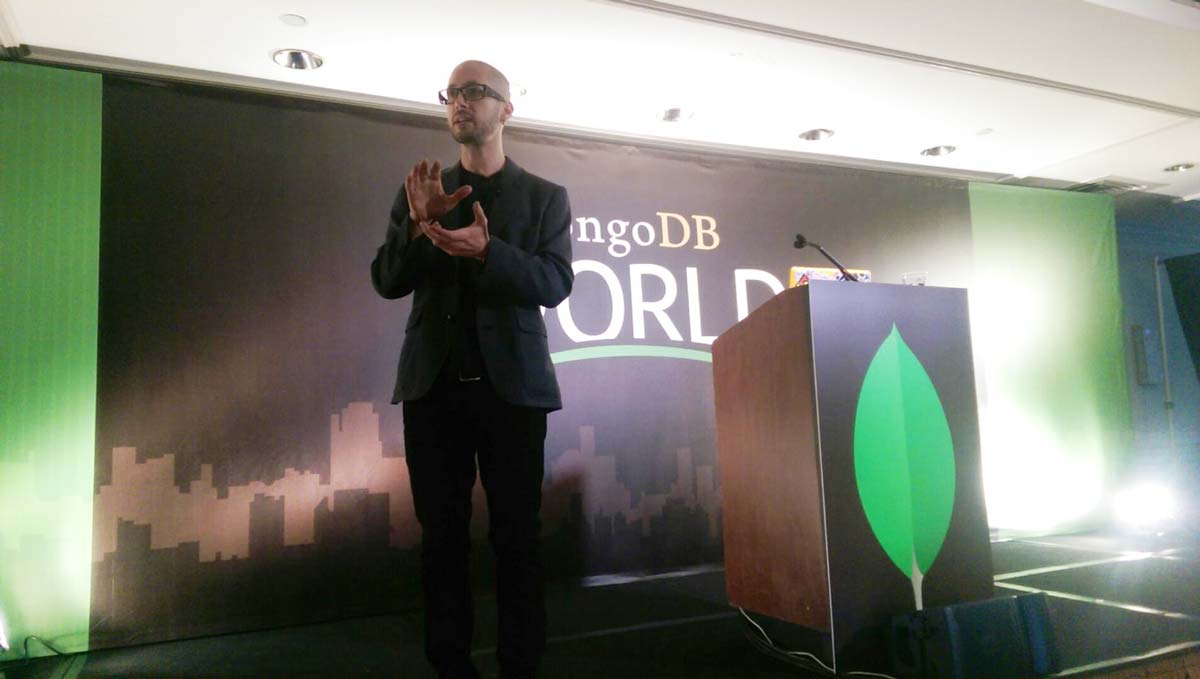
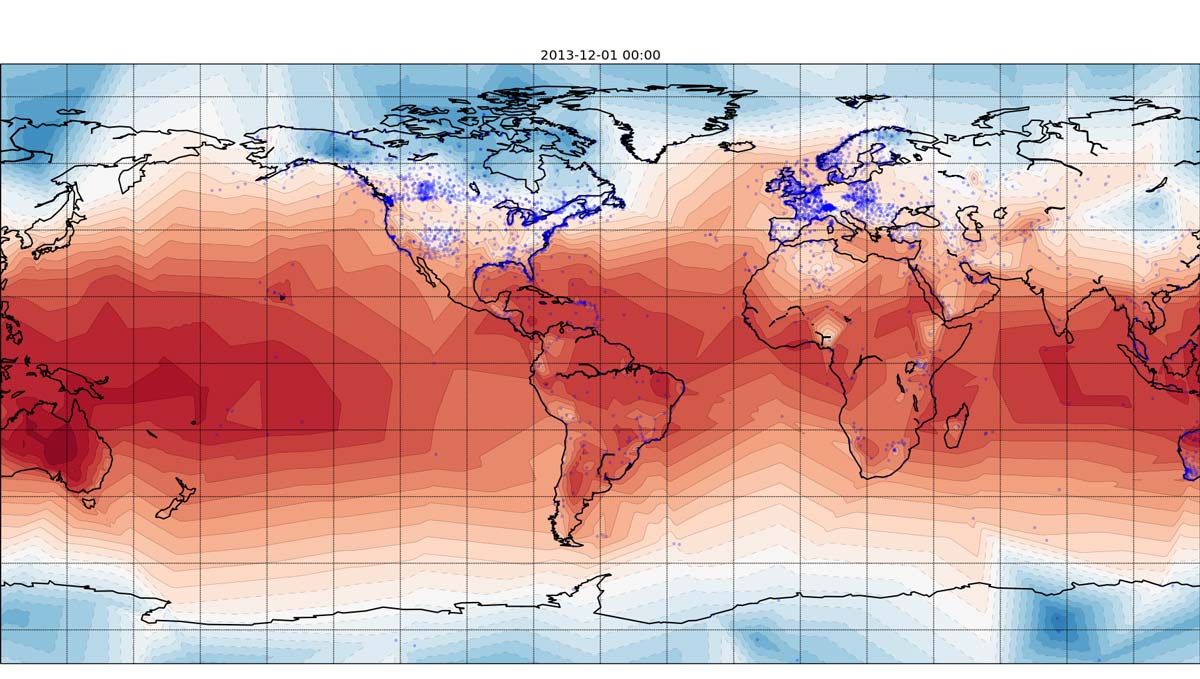
Today I talked to a small audience at MongoDB World in New York City. I described how I made a visualization of global weather data using MongoDB, Python, Monary, and Matplotlib. The visualization looks like this:

My talk was one of a three-part series called "The Weather of the Century". My colleague Randall Hunt gave a schema design talk about weather data, and André Spiegel, who was the brains behind the whole idea, analyzed the performance of various MongoDB configurations executing various operations on terabytes of data.
In the next week I plan to write an article on how I generated this visualization. I also want to write an introduction to Monary: it's a little-known, highly specialized MongoDB driver capable of shocking throughput.
Tomorrow I'm flying to Portland, Oregon to catch the second half of Open Source Bridge. I'll exhort the audience to write an excellent programming blog. I hope they take my advice!