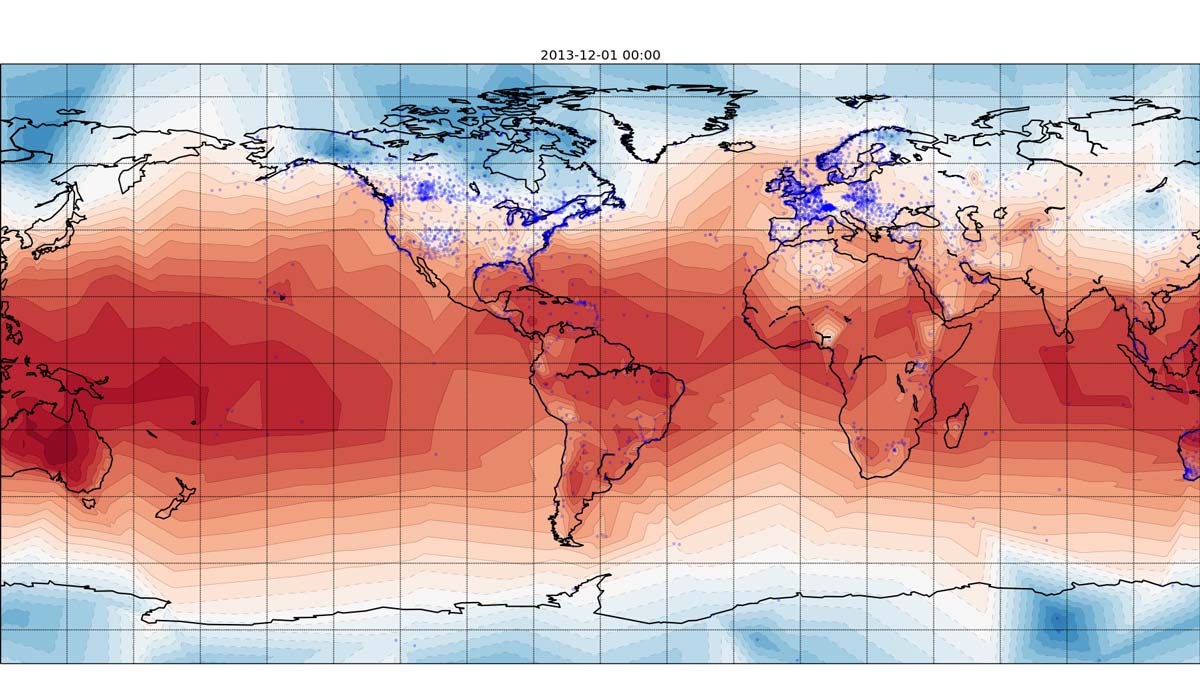
Links to further reading related to my "Weather of the Century" talk, about visualizing weather data using Python, MongoDB, and other open source tools. Here's some links if you saw my talk and want more information.
NumPy: The fundamental data format for scientific computing in Python: http://www.numpy.org/.
SciPy: A huge collection of fast algorithms for analyzing NumPy data: http://www.scipy.org/.
MatPlotLib: A charting library of vast capabilities, works great with NumPy arrays: http://matplotlib.org/
Monary: This is a high-performance driver that queries MongoDB and stores the data directly in NumPy arrays: https://bitbucket.org/djcbeach/monary/
Our Example App: All the code for loading and analyzing NOAA's weather data: https://github.com/drmirror/century
Video: My presentation of this talk at MongoDB World 2014.
Price Performance Analysis: My colleague André Spiegel gave a surpassingly good talk about loading and querying 4 terabytes of weather data on EC2.