Plop: Python Profiler With Call Graphs
Tornado's maintainer Ben Darnell released a Python Low-Overhead Profiler or "Plop" last year, and I'm just now playing with it. Unlike cProfile, which records every function call at great cost to the running process, Plop promises that "profile collection can be turned on and off in a live process with minimal performance impact."
A Plop Collector samples the process's call stack periodically (every 10 milliseconds by default) until you call Collector.stop(). Plop's profile viewer is a web application built on Tornado and d3.js, which uses a fun force-directed layout to display your process's call graph. You can use the demo scripts from Plop's repo to make an example profile:

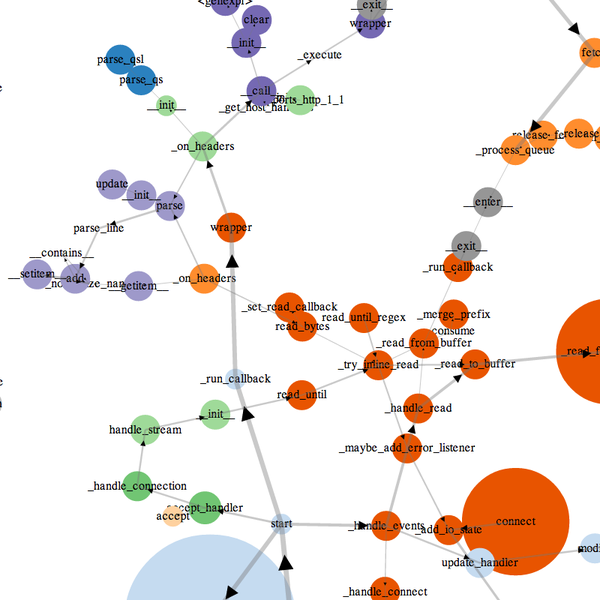
Functions are shown as circles, sized according to the number of times they were executed and colored according to filename. Edges connect callers to callees. The visualization nearly freezes Firefox but runs well in Chrome.
Plop isn't going to replace cProfile and RunSnakeRun, but that's not its intention. Better to think of it as a lightweight complement to the heavier machinery: Plop is nice for visualizing call graphs (which RunSnakeRun does badly) and for sampling a live process in a performance-critical environment.