Current and Future Tools for Interactive TLA+
This is a talk I gave at the 2021 TLA+ conference with my MongoDB colleague Samyukta Lanka. The video is below, and a written version below that.
Update: See this Twitter thread for important corrections. Many of the features we asked for are already possible, but obscure.
Table Of Contents
Precise vs. holistic #
In our experience there are two ways to understand a system: precisely or holistically. (This isn’t a super well-developed philosophy, just our observation.) The precise way of understanding involves well-defined questions like, “Does the system obey a particular invariant or property?” There are lots of powerful tools for this; this is what TLA+ and TLC are for.
The holistic way of understanding involves vague questions like, “Does the system generally conform to my theory of the system?” Holistic understanding usually requires interaction or visualization. Samy and I are programmers, and programmers use tools when we want to understand code: We can interact with a program by trying some inputs and watching the program run. We observe it with debugging, logging, and profiling. We can use visualization tools like flame charts and call graphs.
In contrast, TLA+ feels like math to us. TLA+ writers spend less time trying things out, and more time reasoning, which is slower and prone to different sorts of mistakes. So, our proposal in this talk is to make TLA+ more like programming: more interactive and visual. We’ll review the existing tools and suggest new ones.
Questions about your spec #
Spec authors ask different questions at different times, and different tools are best for answering different questions. For example:
- Does my spec imply my invariants / properties?
- Why is my invariant / property false?
- What does this TLA+ expression mean?
- Is the spec generally behaving as intended?
- Why isn’t my action enabled?
- How does this edit affect the spec’s behavior?
- How do I use TLA+ to communicate behaviors to other people?
The first question, “Does my spec imply my invariants / properties”, is the most thoroughly supported. It’s the main purpose of model-checking and proofs, and it’s where most of the research seems to go. TLC and TLAPS are production-quality, and there are new tools like Apalache.
As we go down the list there are vaguer questions like “Is the spec generally behaving as intended?” or “How do I use TLA+ to communicate behaviors to other people?” These are decreasingly well-supported. The tools are only prototypes or don’t exist at all.
Why is my invariant or property false? #
You ask this question when you have a wrong hypothesis about your spec: you either didn’t write the spec you thought you did, or the spec doesn’t behave as you think. What precisely is the mismatch between your hypothesis and reality? How can the tools help you find it? Specifying Systems § 14.5.2 “Debugging a Specification” is a particularly good section about this, so we won’t repeat it, but we’ll try to add a bit.
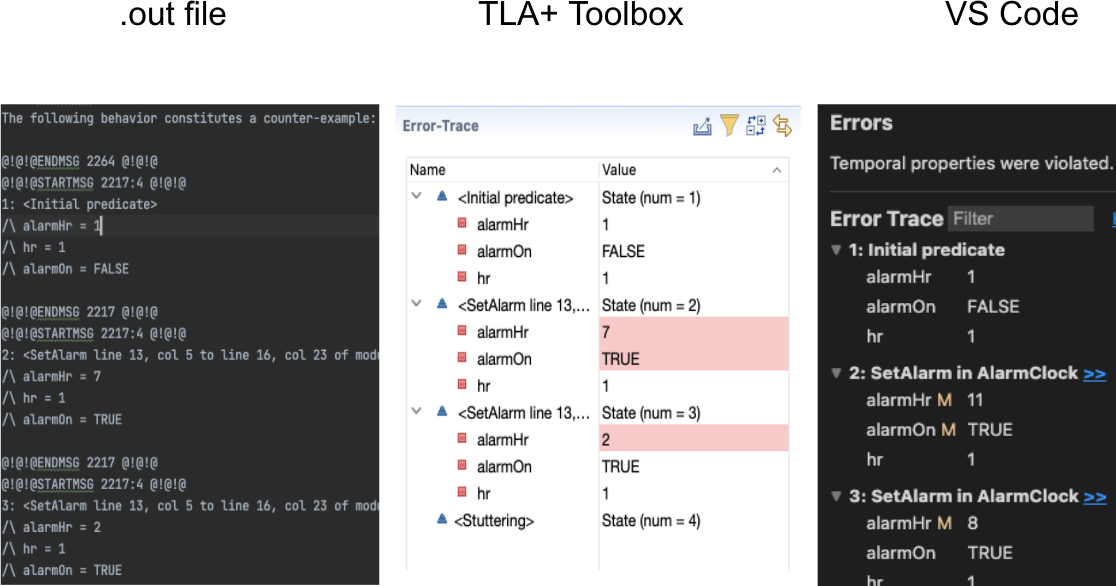
Error traces are the main technique for answering this question. You can view the plain-text trace in a .out file, or a GUI trace in the TLA+ Toolbox or VS Code.
Samy’s and my colleague at MongoDB, Siyuan Zhou, made an alternative called tla-trace-formatter:
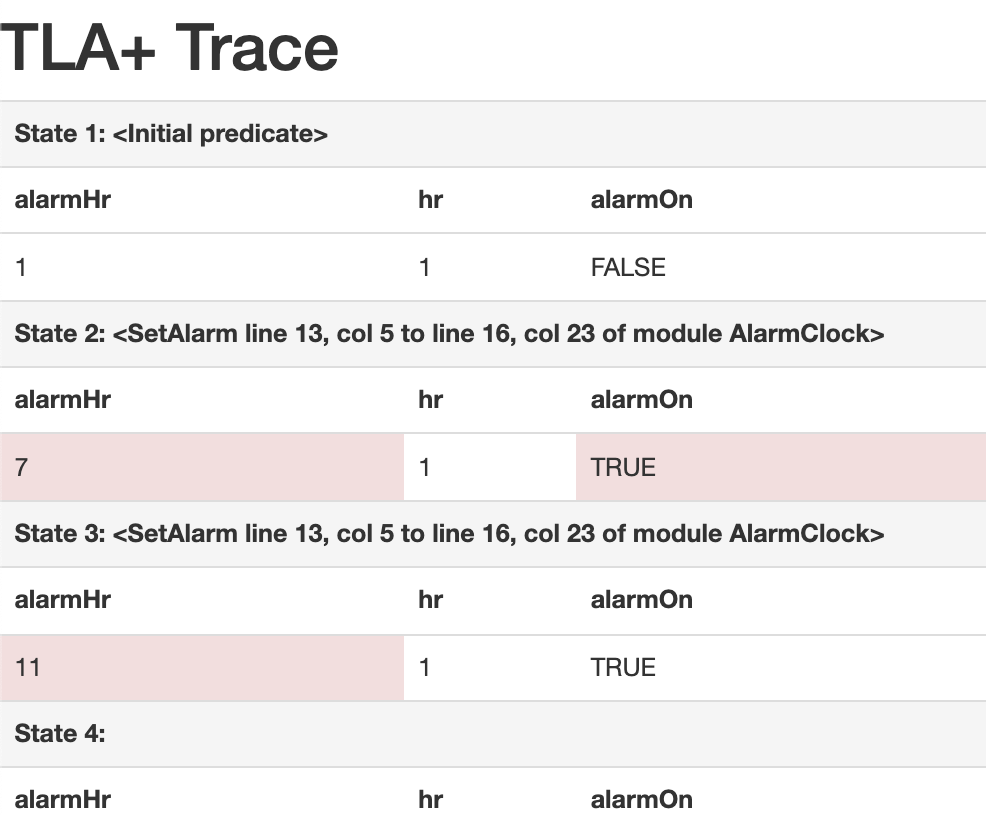
This is a nice HTML version of a TLA+ trace. It’s obviously easier to read than the plain-text output from TLC. And unlike the Toolbox or VS Code GUIs, you can publish this on the web and share it with colleagues to communicate about spec behaviors. We think that “export to HTML” would be a nice feature for the Toolbox.
What does this TLA+ expression mean? #
If you want to experiment and see what some constant TLA+ expression evaluates to, the new REPL is useful. Our former colleague Will Schultz contributed it last year (before he left MongoDB for grad school). Samy and I think it’s especially helpful for beginners, but it’ll be occasionally valuable for any TLA+ user. Download a recent TLC build (the latest release is December 2020 and doesn’t have it) and invoke the REPL thus:
$ java -cp tla2tools.jar tlc2.REPL
Enter a constant-level TLA+ expression.
(tla+)
Let’s say you wanted to understand Bags better. (The REPL preloads some standard modules like Bags and Sequences.)
(tla+) SetToBag({"a", "b"})
[a |-> 1, b |-> 1]
(tla+) SetToBag({1, 2})
<<1, 1>>
When we were playing with this, we were surprised to see that SetToBag({1, 2}) is a tuple. We had to think about it for a second, and it felt like a discovery, something we didn’t know we didn’t know. That’s the great advantage of interacting with a system instead of just reasoning about it.
The REPL is a prototype. It doesn’t have syntax highlighting. We hear that it can extend and instantiate user-written modules, but it’s not well-supported and it crashed when we tried it. If it were more well-developed the REPL would make TLA+ much more interactive.
Is the spec behaving as intended? #
Samy and I have this vague question when we start writing specs. It’s not a precise assertion, it’s a general lack of confidence that we’ve specified what we think we’ve specified, without mistakes. If it were a program we’d add print statements or breakpoints, give it some input and see what it does. We don’t have a specific hypothesis like “the program obeys this invariant or that temporal property”, we just watch it run and see if anything looks wrong to us. But print output is confusing in TLA+ model-checking.
Print expressions #
Let’s take the HourClock module from Specifying Systems and add a print expression to see how the “hour” variable changes.
VARIABLE hr
HCini == hr \in (1 .. 12)
HCnxt ==
    /\ hr' = IF hr # 12 THEN hr + 1 ELSE 1
    /\ PrintT(<<"hr is ", hr, "hr' is", hr'>>)
HC == HCini /\ [][HCnxt]_hr
Here’s the output:
<<"hr is ", 4, "hr' is", 5>>
<<"hr is ", 3, "hr' is", 4>>
<<"hr is ", 2, "hr' is", 3>>
<<"hr is ", 5, "hr' is", 6>>
...
We expected hr to begin at some value and increase sequentially like “4 5 6”, but instead we get a random-looking order of states. The model-checker is doing a parallelized breadth-first search of states, not a straightforward sequence of steps like a program would, so we don’t see one behavior in order.
TLC’s simulation mode makes print more useful. Enable it in the Toolbox’s “TLC Options” pane and set max traces to 1. Oddly, you also have to set “Number of worker threads” to 1. Instead of this UI, we think a Toolbox button that says “show me one random behavior” would be a useful feature for spec developers to get quick feedback. Anyway, once simulation mode is configured you get what you want:
<<"hr is ", 4, "hr' is", 5>>
<<"hr is ", 5, "hr' is", 6>>
<<"hr is ", 6, "hr' is", 7>>
<<"hr is ", 7, "hr' is", 8>>
Each time you run TLC, it gives you one example behavior. The hour clock starts at an arbitrary value, in this case 4, and then you see consecutive states of one behavior, so now print is actually useful. This is a great way to see if the spec is generally behaving according to your theory of the system, without asking any precise questions.
But, a random sample of traces may not cover the part of the spec you’re most worried about. You can home in on worrisome behaviors by overriding the initial predicate:
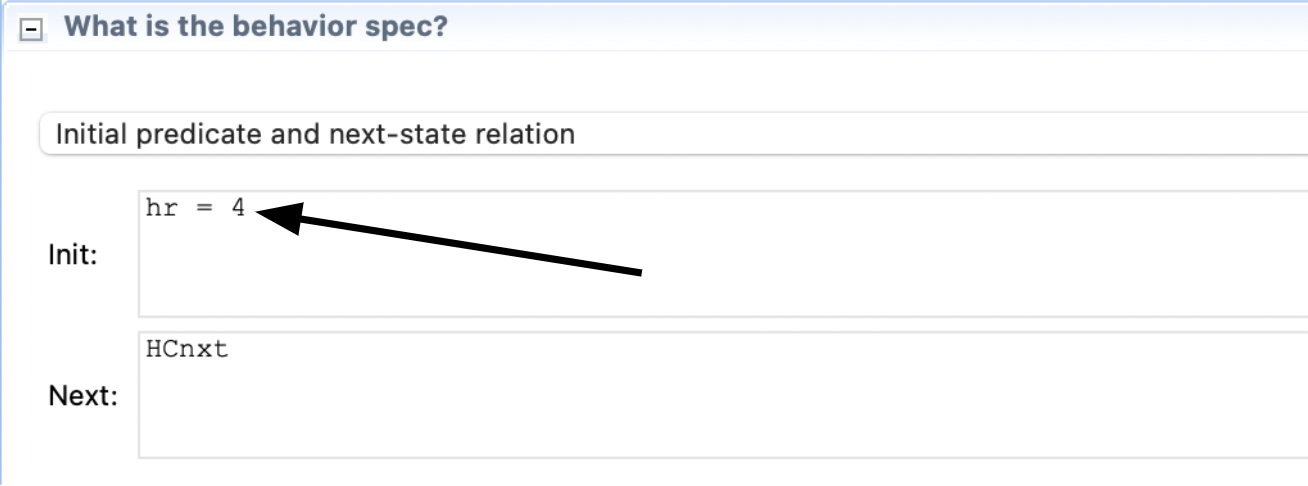
Either hand-write it, or if you have an error trace, the Toolbox has a feature to copy any state of the trace into the initial predicate.
Visualizing the state graph #
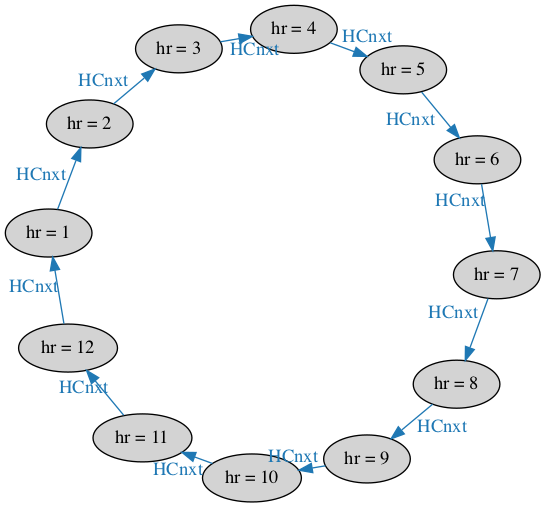
Besides print expressions, another tool that’s tempting for beginners is visualizing the state graph with Graphviz. The Hour Clock’s graph looks like this:

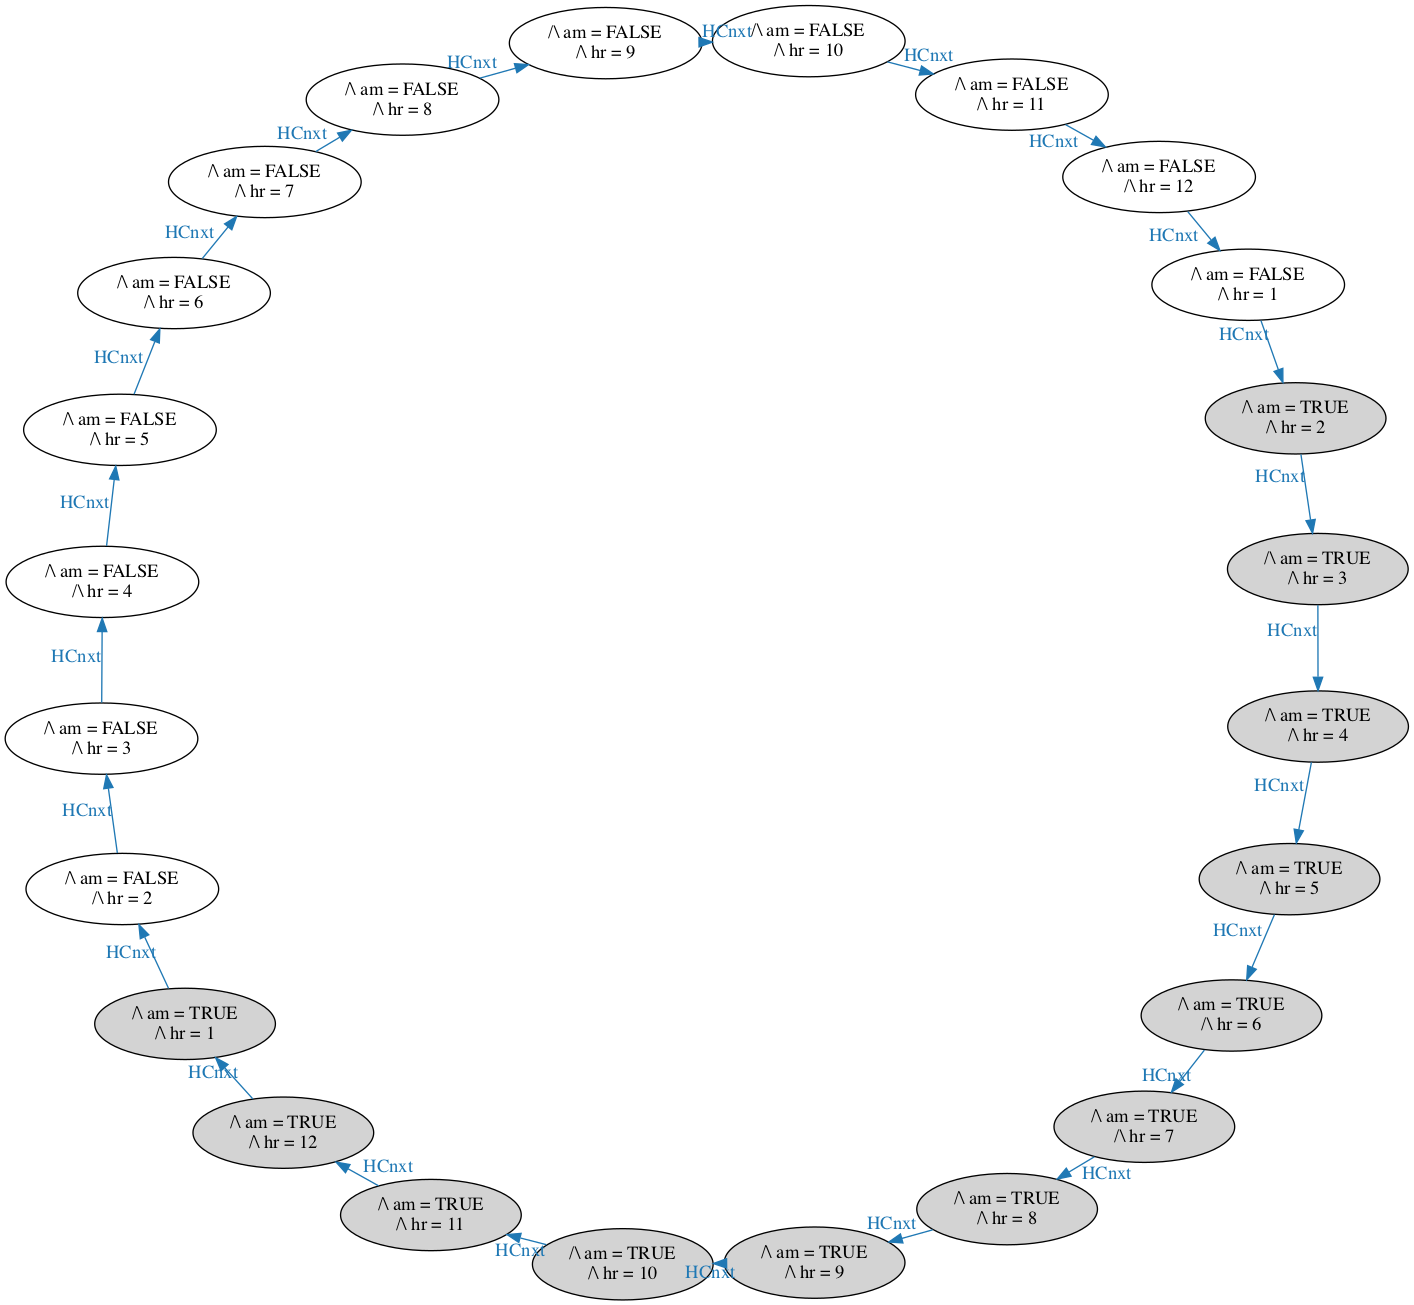
We’d prefer a nice circle of 12 states. (It would look like a clock!) Tweaking the TLC output and using neato produces:
Let’s see if the state graph is useful for answering, “Is the spec behaving as intended?” Imagine we incorrectly add an AM/PM indicator to the clock. It starts with am = TRUE, and it flips at noon and midnight.
\* Incorrectly add am/pm to HourClock
EXTENDS Naturals
VARIABLE hr, am
HCini == hr \in (1 .. 12) /\ am = TRUE
HCnxt ==
    /\ hr' = IF hr # 12 THEN hr + 1 ELSE 1
    \* Oops, AM/PM should flip at noon/midnight, not 1 o'clock.
    /\ am' = IF hr = 12 THEN ~am ELSE am
HC == HCini /\ [][HCnxt]_<<hr, am>>
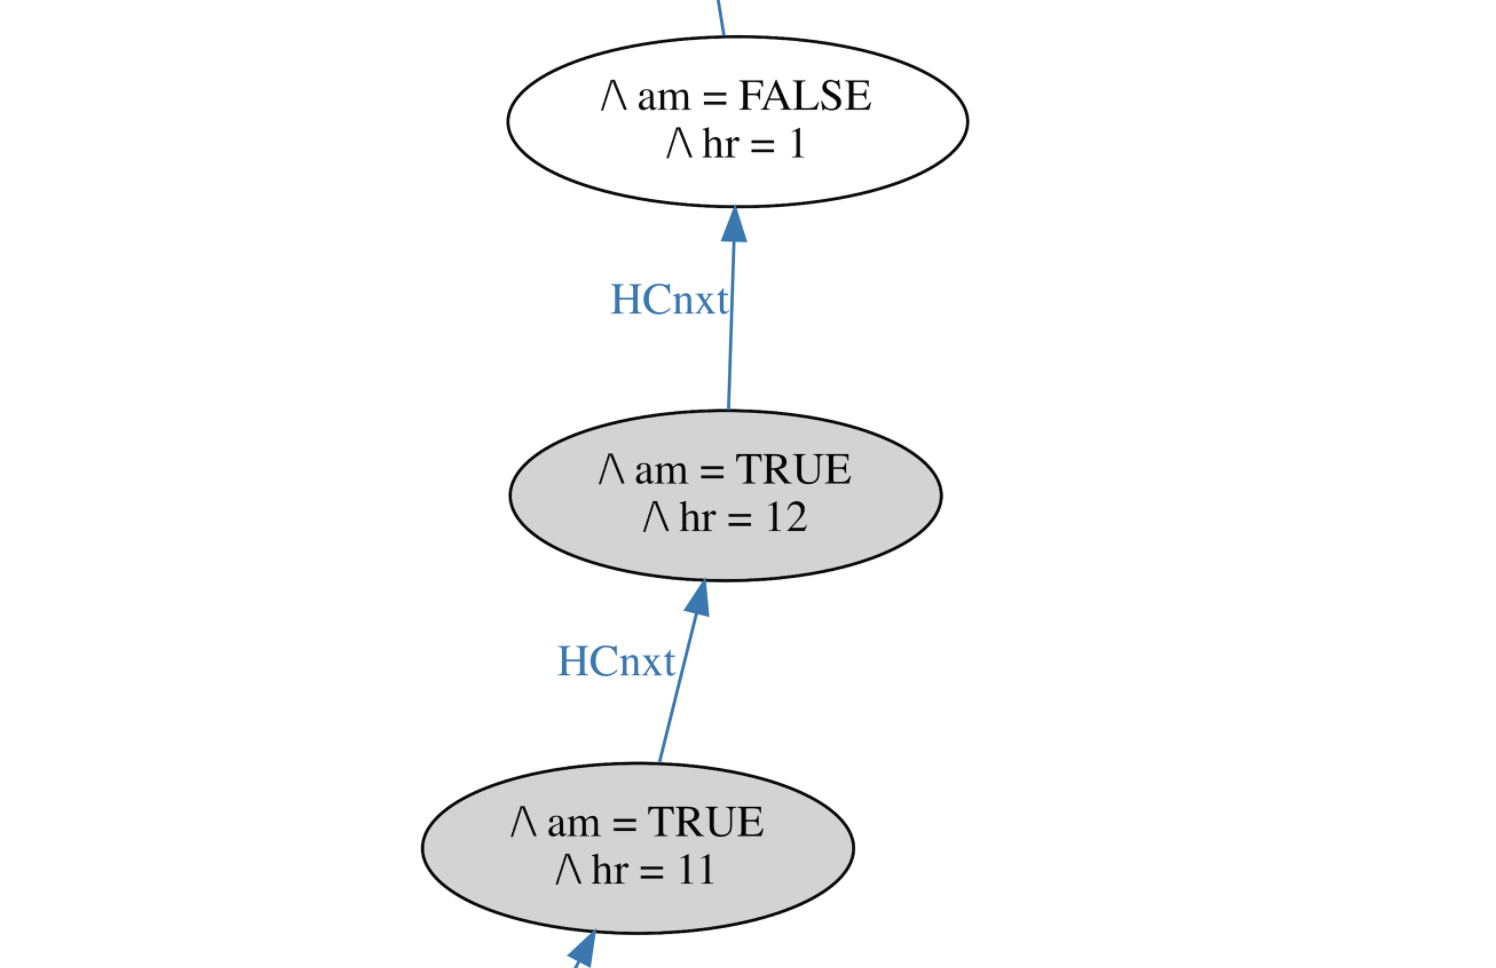
But we have a bug. AM actually flips when the hour goes from 12 to 1, not when it goes from 11 to 12 as intended. If we were debugging a program we might step through it and see our mistake. With TLA+, will the mistake be obvious from the state graph?
TLC colors the states by variable values, so AM is gray and PM is white. (Correction: TLC colors initial states gray and others white.) Again, this nice layout required manual tweaking. If we zoom in, we might notice that this is an unintended transition: AM flipped from TRUE to FALSE when the hour went from 12 to 1. Whoopee, we found a bug!
But this kind of visualization isn’t usually helpful for answering, “Is the spec behaving as intended?” Real specs have thousands or millions of states. A MongoDB spec Jesse is writing has 11,000 states, which is small for a real spec, but it produces this hairball:
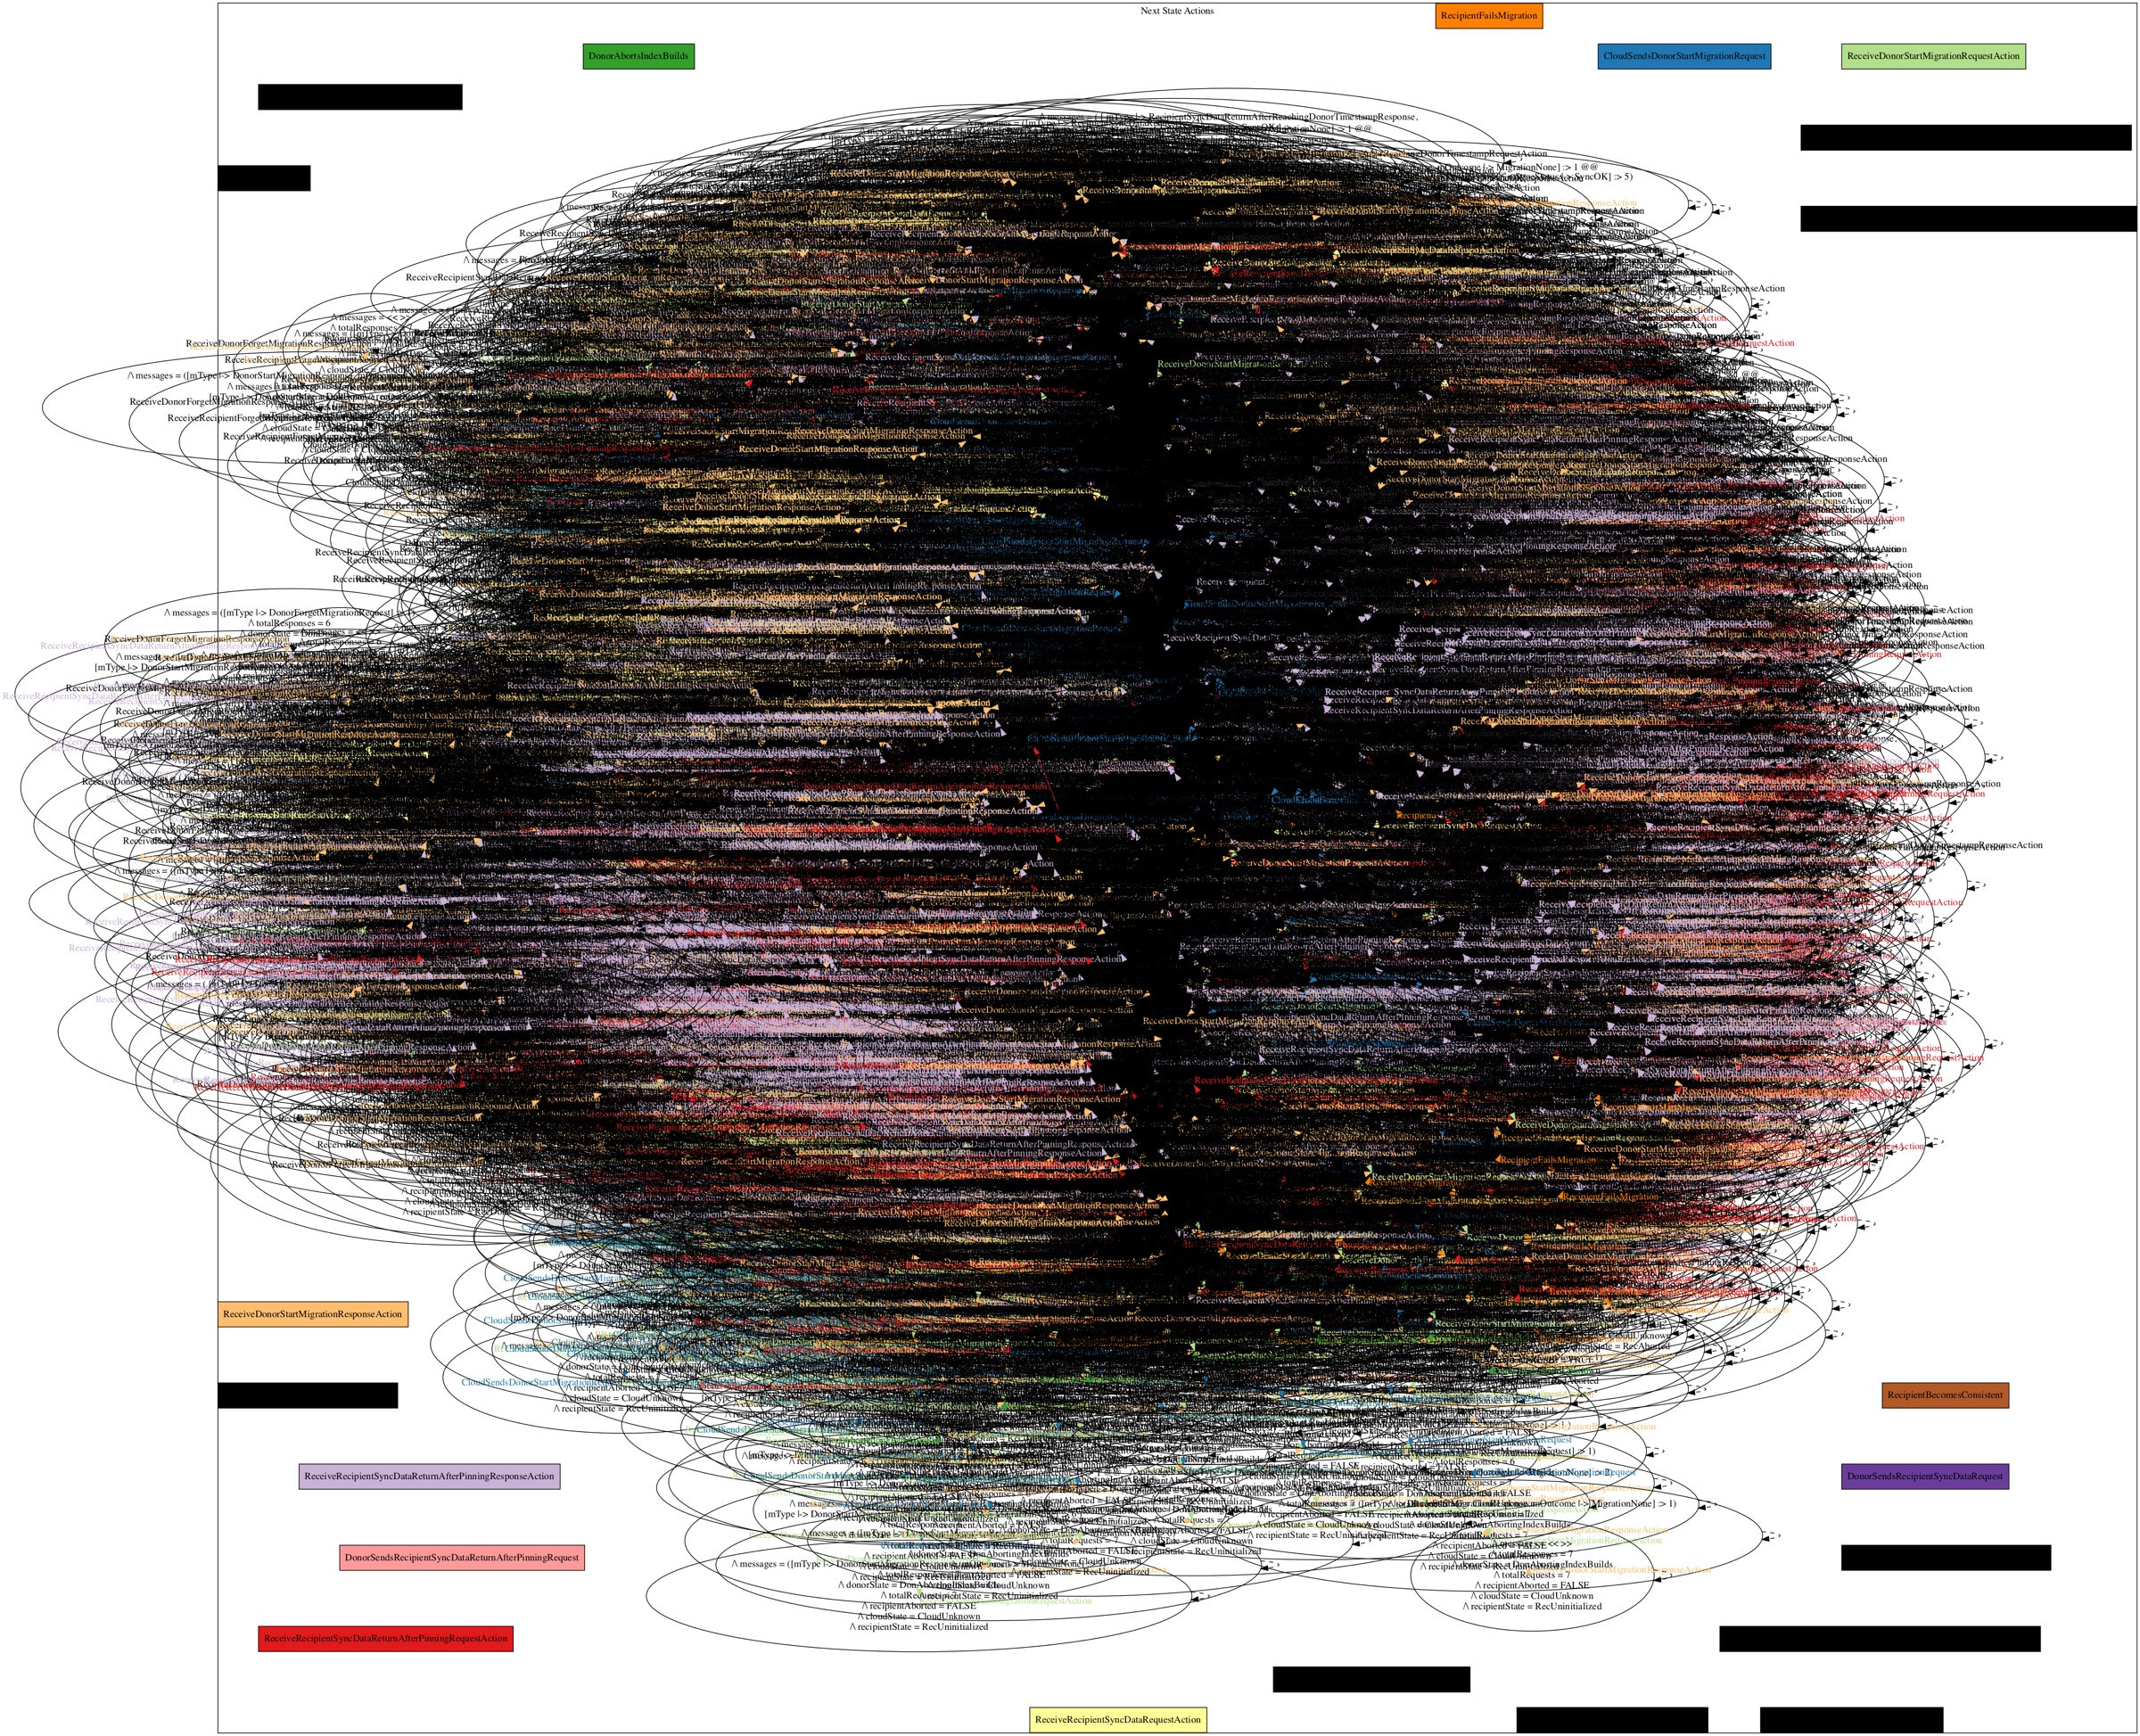
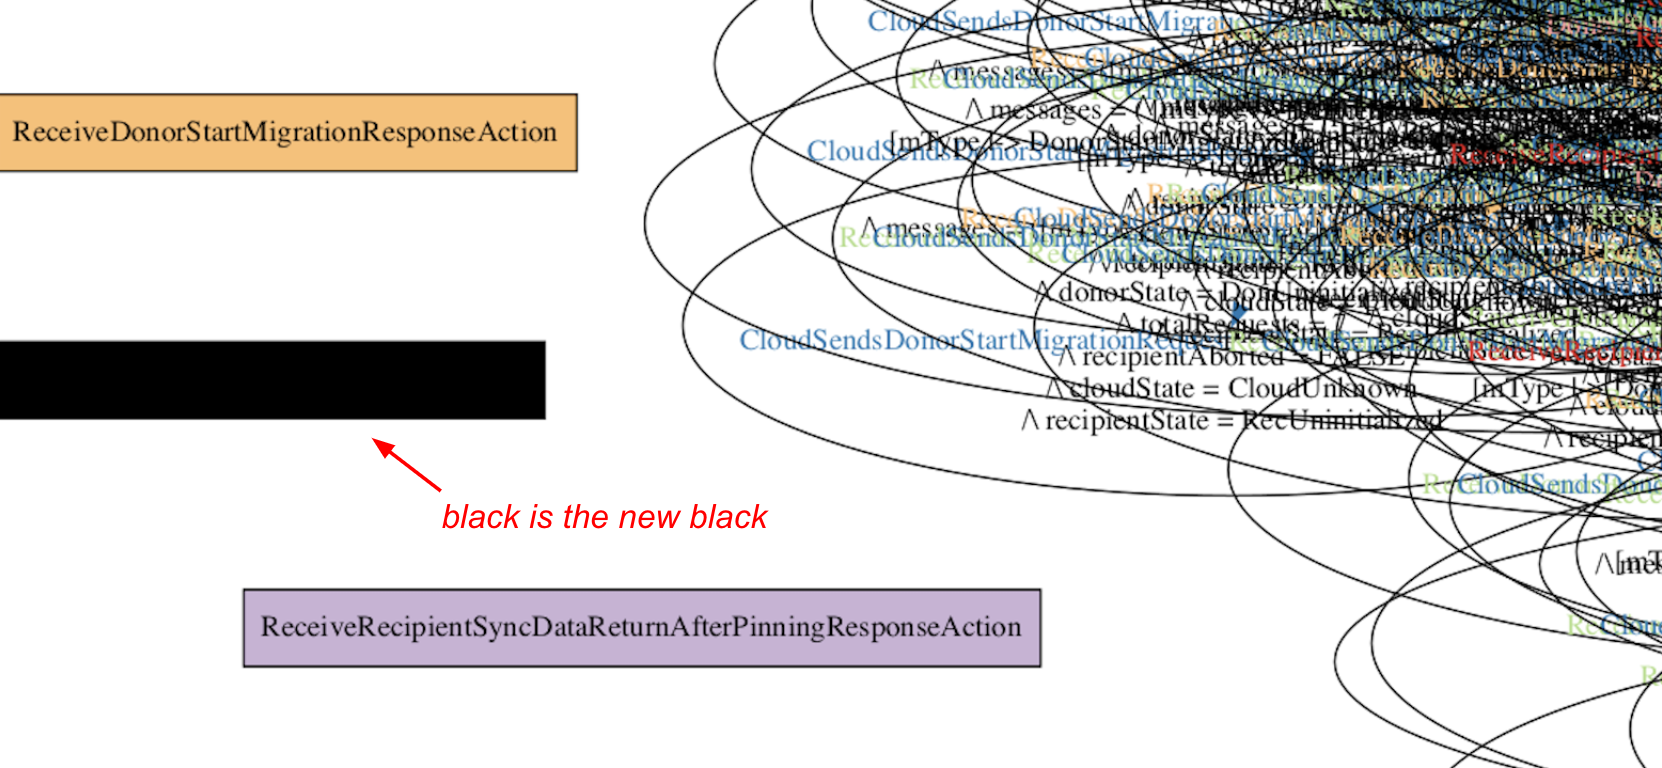
It’s no better even if we zoom in (and if one of the labels weren’t completely black).
Graphviz is mainly useful for beginners to learn the concept of a state space. For real specs, profiling is a much better tool for answering, “Is the spec behaving as intended?”.
Profiling #
Let’s consider a new example: an alarm clock.
VARIABLES hr, alarmHr, alarmOn
vars == <<hr, alarmHr, alarmOn>>
HCini ==
    /\ hr \in (1 .. 12)
    /\ alarmHr \in (1..12)
    /\ alarmOn = FALSE
AdvanceHour ==
    /\ hr' = IF hr # 12 THEN hr + 1 ELSE 1
    /\ UNCHANGED <<alarmHr, alarmOn>>
SetAlarm ==
    /\ alarmHr' \in (1..12)
    \* Oops, forgot to set alarmOn' = TRUE
    /\ UNCHANGED <<hr, alarmOn>>
Ring ==
    /\ alarmOn \* Oops, alarmOn is always FALSE
    /\ hr = alarmHr
    /\ alarmOn' = FALSE
    /\ UNCHANGED <<alarmHr, hr>>
HC == HCini /\ [][AdvanceHour \/ SetAlarm \/ Ring]_vars /\ SF_vars(Ring)
This is the hour clock again, with an alarm that can be set to any hour. But, as you see above, the alarm never rings. The TLA+ profiler makes this mistake obvious.
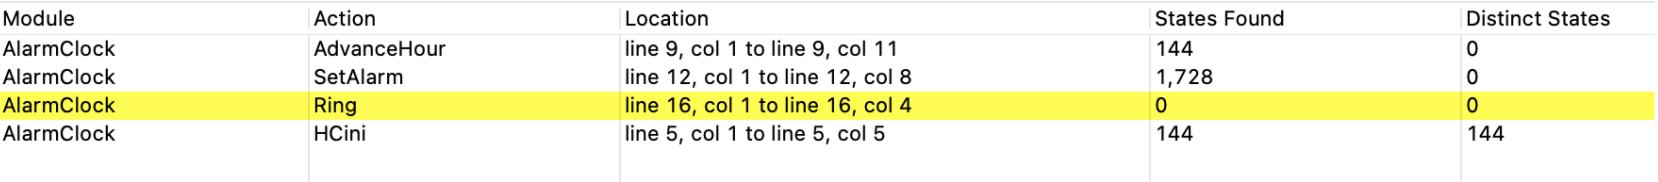
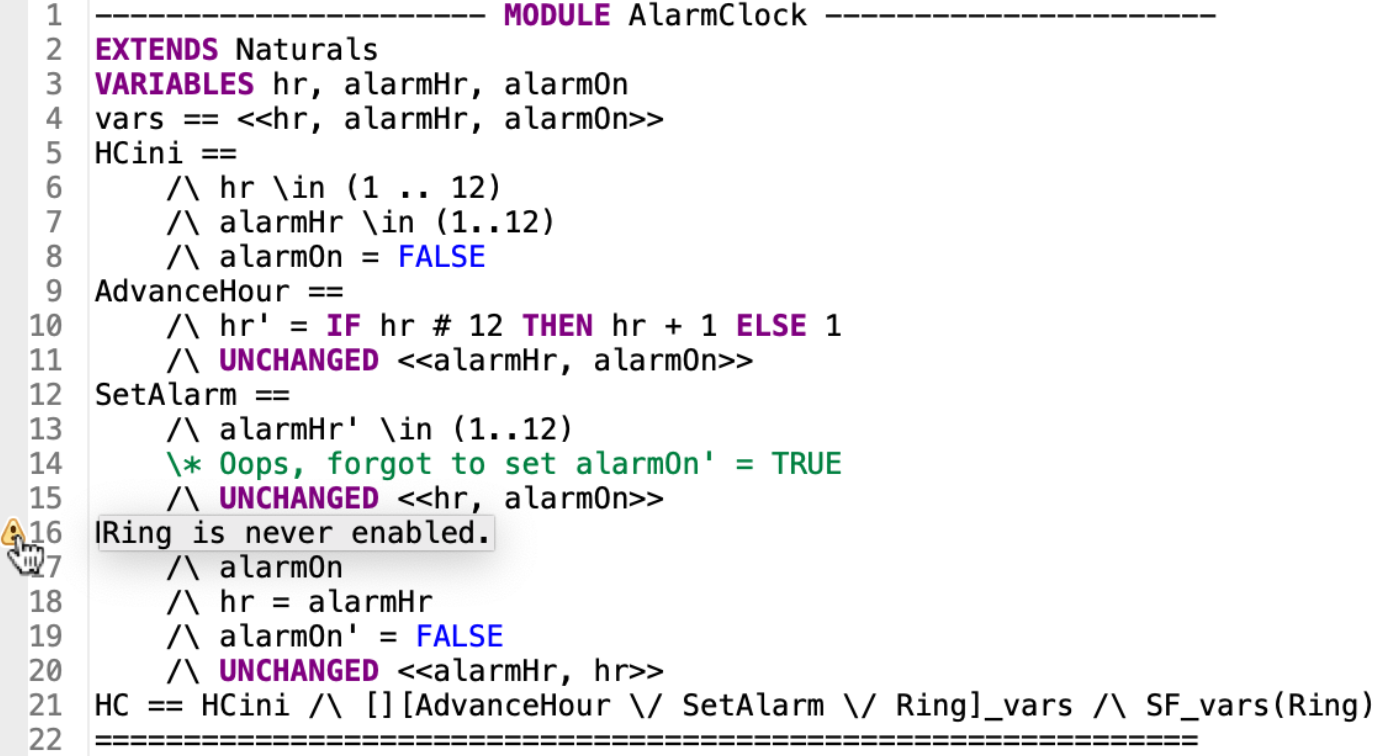
You’ve probably seen this in your own specs: the Toolbox shows a warning when an action is never enabled. (The warning appears if “action enablement” profiling is on, which it is by default.) The warning also appears when you’re looking at the spec source.
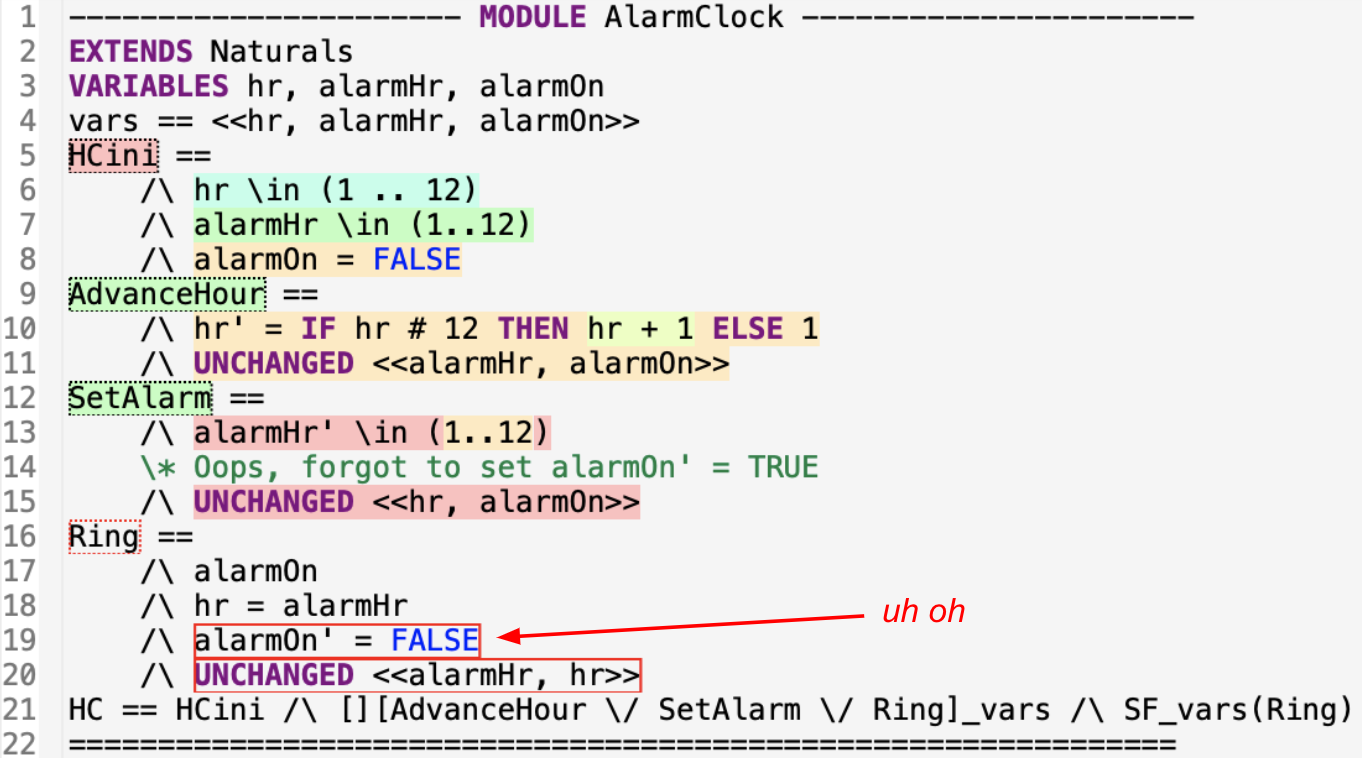
If you turn on full profiling, the never-enabled action and the un-evaluated expressions are outlined in red. Something is almost certainly wrong if you wrote an expression that’s never evaluated.
It’s hard not to notice a never-enabled action if you’re looking at the Toolbox GUI. But at MongoDB, we run the model checker unsupervised in our continuous integration servers, to make sure we don’t commit a spec change that fails model-checking. What if we wanted TLC to check that every action is sometimes enabled? That’s a hyperproperty and we can’t write that assertion in TLA+. We propose a TLC option to fail model-checking if any action is never enabled, and perhaps if any expression is never evaluated.
ShiViz #
If your spec involves nodes that exchange messages with a vector clock, ShiViz is a terrific visualization tool to check that your spec behaves as intended. Configuring ShiViz is a few hours investment, so it’s not the first tool to reach for, and it’s not the right way to catch bugs in your TLA+ syntax, like you wrote /\ when you meant \/. Use ShiViz to understand design bugs, e.g. race conditions in your protocol.
ShiViz creates visualizations from traces or log files, which it parses with a regular expression you must provide. It comes preloaded with a trace from Markus Kuppe’s TLA+ spec for distributed termination detection and a regex for parsing it, which gives you a snazzy interactive space-time diagram.
ShiViz can find “motifs”, which are common communication patterns in the trace, and it has a sophisticated feature for comparing traces to each other. Samy and I haven’t explored these yet but we think it would reveal which patterns are associated with successful executions and which are associated with failure; it sounds like an incisive diagnostic tool.
ShiViz doesn’t know about TLA+, it expects the vector clock to be printed as JSON. Here’s Markus’s code for integrating his TLA+ spec with ShiViz. He uses the Json module to print the vector clock and the new Alias feature to customize TLC’s trace output.
------------ MODULE EWD998ChanID_shiviz -------------------
EXTENDS EWD998ChanID, Json

(* ... deleted code ... *)

Alias ==
    [
        Host |-> host
        ,Clock |-> ToJsonObject(clock[host])
        ,active |-> active
        ,color |-> color
        ,counter |-> counter
        ,inbox |-> inbox
    ]
==========================================================
ShiViz (and its companion TSViz for multi-threaded systems) can provide us a holistic understanding of specs of certain kinds of systems. We’ll probably use it the next time we write a spec like this. We propose adding features either to TLC or to ShiViz/TSViz to make integration easy for the ordinary programmer. Perhaps it’s easy already and only the documentation is missing.
Why is my action never enabled? #
Let’s consider the alarm clock again. We had a Ring action that’s never enabled, so our natural question is, “Why is my action never enabled?” We asked a couple experts what tools are useful for this question, but they came up empty. They told us to try “staring really hard” at the spec. Developing a tool for this is a good research problem.
Here’s a frequent cause of never-enabled actions:
Push(stack, x) ==
    stack' = Append(stack, x)

Pop(stack) ==
    stack' = SubSeq(stack, 1, Len(stack) - 1)

Init == myStack = <<"x">>

SomeAction ==
    /\ Pop(myStack)
    /\ Push(myStack, "y")
\* Above is equivalent to stack = <<>> /\ stack = <<"y">>, which is FALSE
SomeAction uses two operators, Push and Pop, which use the same primed variable. This is natural for programmers, we might think SomeAction means, “pop the stack, then push a value”, but in TLA+ it’s a contradiction that’s always FALSE. Jesse was bitten by this in a real spec at MongoDB. The bug was buried deep enough that it took him hours to discover it. We think anyone who writes code like this is probably making a mistake, so we propose that TLC should prohibit contradictory uses of a primed variable in an action. That would make one variety of never-enabled actions easy to diagnose; it remains a mystery what sort of tool could answer this question in general.
How does this edit affect the spec’s behavior? #
Programmers like Samy and me typically write specs iteratively: we complete a spec, then return months or years later to model a new feature in the system we’re specifying. This is like the HourClock AM/PM example above: we took a trusted spec from Specifying Systems and made changes, and we want to see how those changes specifically affect its behavior.
VS Code debugger #
The TLA+ debugger that Markus Kuppe recently prototyped in VS Code is useful for experimenting with changes to a spec. At the moment you must go to Markus’s fork of the VS Code TLA+ extension and download the latest .vsix. (Correction: the debugger has been merged into the mainline TLA+ extension.) In VS Code, go to Extensions, click “…” and “Install from VSIX”, select the downloaded file, and reload VS Code. Open a .tla file in VS Code (there should be an associated .cfg file), right click, choose “Check and debug model in TLC”. (The debug action is special to Markus’s fork.) Now you can set breakpoints and step through the evaluation of expressions within an action. VS Code displays the values of primed and unprimed variables, and the trace that led to the current state.
However, you have the same problem as with print statements (above): the model checker is doing a breadth-first search through the state space. Each time you hit a breakpoint, it will be a different execution. We propose a feature that would run the debugger in simulation mode, so you can step through one behavior sequentially.
Let’s see if the debugger can help us see our mistake in the AM/PM indicator for the hour clock. In the video above, we set a breakpoint in the action we changed and run the debugger. We’re looking for a trace that’s interesting to us, namely when hr = 12, which requires us to hit “continue” many times. Once we’re there, we can inspect the variable values and easily see our mistake: we change am one hour too late.
The debugger is invaluable for understanding how any action is evaluated, but the lack of conditional breakpoints makes it too cumbersome to use for iterative spec development. Markus has said that conditional breakpoints are coming soon; iterative development will be feasible with the debugger once we have them, along with watchpoints: the debugger breaks when a variable changes, i.e. an action assigns a different value to the primed variable.
How do I communicate behaviors to other people? #
Often, a spec author is the only TLA+ user on a team, but they need to communicate a behavior to others. You might want to share a counterexample that violates an invariant and demonstrates a protocol bug. Our MongoDB colleague Will Schultz contributed the TLA+ animation module for this purpose.
(We stole this gif from Markus’s TLA+ workshop.)
The module provides TLA+ operators that generate SVG drawings for each state in the trace; we can merge them into an animation. But developing the animation is arduous. The module’s operators are primitive and you must lay out your shapes with absolute positioning; we hope someone contributes more convenient drawing operators.
You can only visualize what you model: e.g. specs of message-passing systems typically don’t record each message’s sender, since it’s not required to check correctness, so you couldn’t animate a message traveling from its sender to its recipient. You could add extra variables or write a refinement of the spec for the sake of animating it.
Future of interactive TLA+ spec development #
We’ve surveyed some tools for precise and holistic understanding, and proposed a few features. Let’s consider other possibilities for TLA+ tools.
Iterative spec development #
When we develop a spec, we want to quickly see the effects of our changes and spot bugs right away. Ideally, tools catch our mistakes as we make them, or at least make them easy to discover. Some IDEs for the top programming languages are very good at this; let’s bring the same ease of use to TLA+.
As we saw above, the TLA+ debugger in VS Code is almost, but not quite, a convenient way to experiment with spec changes. It could benefit from watchpoints and conditional breakpoints, simulation mode, and perhaps from integration with the TLA+ Toolbox. (Correction from Markus: “The debugger doesn’t have a command to launch TLC in simulation mode, but we can pass ‘-generate’ as options to step through a (randomly generated) behavior.”)
When Samy and I gave this talk, several experts in the audience mentioned “state space exploration”. This would be like “choose your own adventure”: at each step of the spec’s execution, you could see all the possible next steps and choose which to follow. Markus showed me that this is possible with TLC today; it should be integrated into the GUIs and publicized.
Experiment with expressions #
For learning TLA+, and for iterative spec development, it’s crucial to experiment with expressions and see what they evaluate to. The standard method today is to change an expression in a spec and re-run the model checker; this is a slow feedback loop and the result is prone to misinterpretation. You could speed up the feedback loop by moving the expression to its own spec temporarily, or by using simulation mode and overriding the spec’s initial predicate. All of this is inconvenient. The TLC REPL is easy to use but only for constant expressions and standard modules: it can’t evaluate expressions in the context of a particular spec state, and we couldn’t figure out how to import definitions from our specs.
It would be convenient if the debugger had watch expressions, or if the REPL were integrated (it’s just another UI for evaluating expressions). It’s a common development pattern in programming languages to write some code until you’re stumped, set a breakpoint at the tricky spot and run the program to there. Examine the program’s state, try out some expressions, and you quickly realize what code to write next. If this were possible with TLA+ we could speed up spec authorship dramatically.
But what if you suspect a bug and you don’t know where to look? Here’s another idea.
Graph of actions that enable other actions #
We saw above that graphing the state space isn’t useful for real specs. Samy and I think an action-enablement graph would be better. Here’s how it would look for the alarm clock:
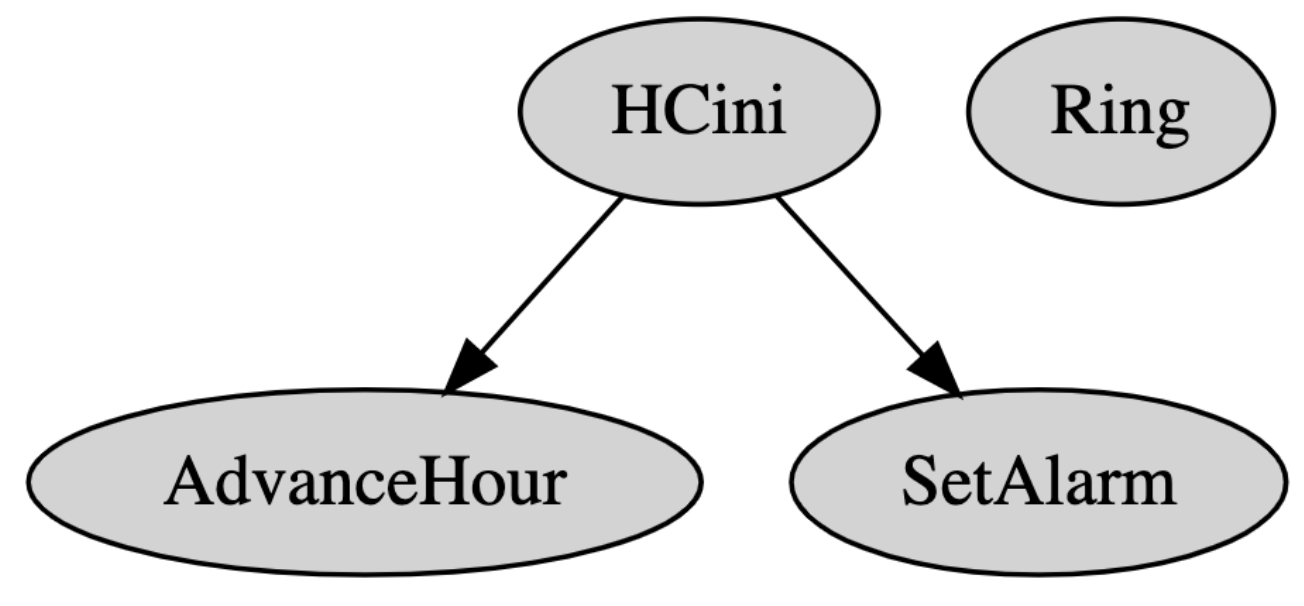
This is like a call graph: if action A changes the state such that action B is enabled, draw an edge from A to B. We expected an edge from SetAlarm to Ring, but it’s obviously absent. So we know either that the enablement conditions for Ring are buggy, or SetAlarm doesn’t change the state correctly. (In fact it’s the latter.) A graph like this makes it easy to narrow down our bug hunt.
We learned in Markus’s workshop that TLC can make such a graph, but it’s not documented or integrated into the GUIs; if it were, it would be a familiar and powerful tool for programmers who write specs.
Variable ranges and distributions #
Leslie Lamport says to always be suspicious of success, but where should we focus our suspicion? The tools are little help at revealing what we don’t know we don’t know. If you don’t craft an invariant, assert, or property to detect a particular mistake, you may never notice it. We need sanity checks.
One sanity check could be generated by the profiler: It could tell us ranges that it encountered for each variable. Here’s a toy example:
\* Try to loop from 1 to 10 and repeat.
VARIABLE x
Init == x \in (1 .. 10)
ActionOne ==
    /\ x = 10
    /\ x' = 1
ActionTwo ==
    /\ x' = x + 1 \* Oops, this could set x' to 11.
We accidentally allow x to grow past 10. We could add an invariant, x <= 10, to catch this mistake, but first we must suspect this mistake exists!
We propose a feature that shows the range of values for each variable in states discovered by the model checker. It could be limited to numeric values or small sets, and it might take a sample of states in simulation mode. For some kinds of specs, this would be a quick way to eyeball the spec’s behavior. In the example above, we might run the simulator for 100 steps, notice that x grew past 10, and realize our mistake.
If the set of discrete values is small enough, we could show a histogram. For example, we might expect x to be TRUE or FALSE roughly evenly in all the states of this spec:
VARIABLE x
Init == x \in BOOLEAN
ActionFlipToFalse ==
    /\ x = TRUE
    /\ x' = FALSE
ActionFlipToTrue ==
    /\ x = FALSE
    /\ x' = FALSE \* Oops, this should be TRUE
... more actions ...
If the model checker showed us statistics about x’s distribution, we’d see that x is FALSE almost always. This isn’t at all the same thing as a probabilistic model checker; it can’t tell us about the likelihood of states in an actual system. But in cases like this it could arouse our suspicion that the spec doesn’t behave as we intend.
Questions for the Audience #
At the TLA+ conference, Samy and I finished our talk asking the audience the following questions:
- What use cases did we miss? What questions have you had about a spec that you didn’t know how to answer?
- What existing features and tools did we miss? How can they be better promoted so programmers like us would find them next time?
- What’s the right direction for making TLA+ easier—more tools, or consolidate more features in one tool? Is that one tool the Toolbox or VS Code or …?
Perhaps you, dear reader, would like to ponder them and answer in the comments, or make a proposal of your own. Or better yet, implement something!